Congratulations, Executive Fellowship 2025 Graduates!
On June 12th, we celebrated our 15th year of the OneJustice Executive Fellowship program with the graduation of our 2024-2025 Executive Fellowship class! Over the
Announcing: OneJustice’s 2025 Champions of Justice
OneJustice is proud to announce the recipients of our 2025 Champions of Justice Award: Disability Rights California, Lawyers’ Committee for Civil Rights of the San

New from OneJustice! Strategic Leadership: Navigating the Now.
A Six-Month Advanced Virtual Program for Executive Directors Now Accepting Applications Deadline: 12:00 PM PST, Monday, May 19th Today’s Challenges Require More The legal aid

Why Legal Aid Board Service is a Powerful Form of Pro Bono
Why Legal Aid Board Service is a Powerful Form of Pro Bono In her insightful article, “Why Serving on a Legal Aid Board Could Be
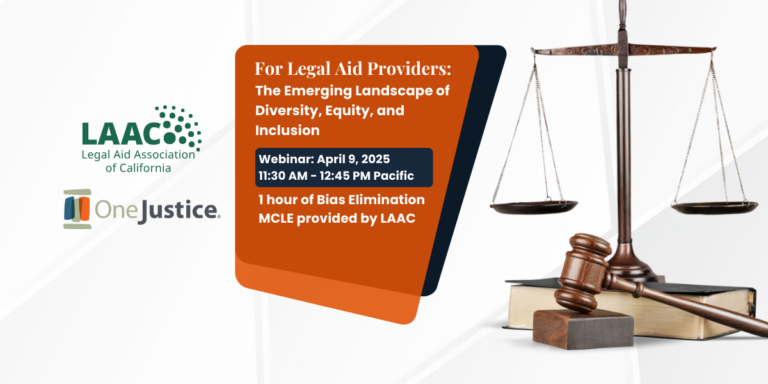
Webinar: The Emerging Landscape of Diversity, Equity, and Inclusion
Please join OneJustice, Legal Aid Association of California (LAAC), Lawyers’ Committee for Civil Rights of the San Francisco Bay Area (LCCRSF), and Public Counsel for
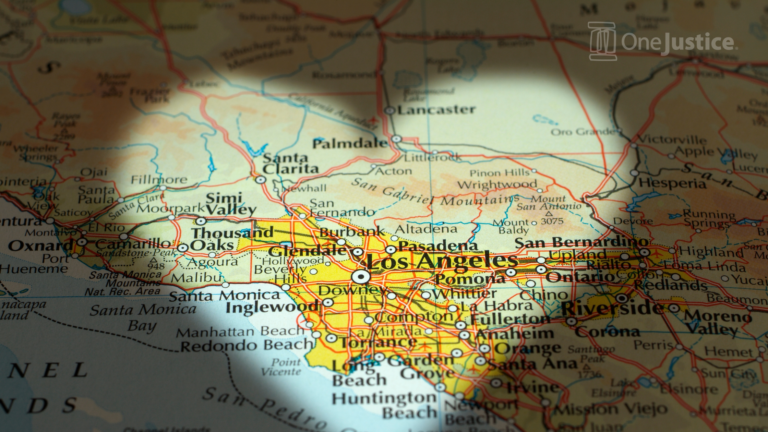
Los Angeles Wildfire Resources
Last Updated 1:18 PM, January 22, 2025 Pro Bono Volunteers Prepare & Train with the Pro Bono Training Institute: Our dedicated disaster response training modules provide